Visual Separation Measures
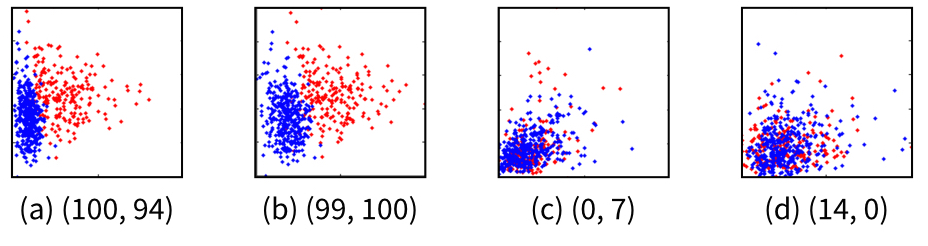
Visual separation measures seek to algorithmically model the human judgement of class separability in color-coded scatterplots. The idea behind these measures is illustrated in the Figure above. In such scatterplots, a human observer has a clear notion of "separated" (a & b) or "not separated" (c & d) classes. Mimicking this human notion of separability is the goal of visual separation measures.
Visual separation measures are a member of the larger family of
Why care?
Visual separation measures can support the explorative process of high-dimensional data. So far, the most typical usage has been to help pre-selecting visually interesting projections in large scatterplot matrices, which show the pairwise combination of all data dimensions.
However, such measures could also help to guide the choice of synthetic dimension reduction algorithms before visualizing the data, or in the automatic evaluation of different types of visual encodings, such as 2D vs. 3D scatterplots.
![]()